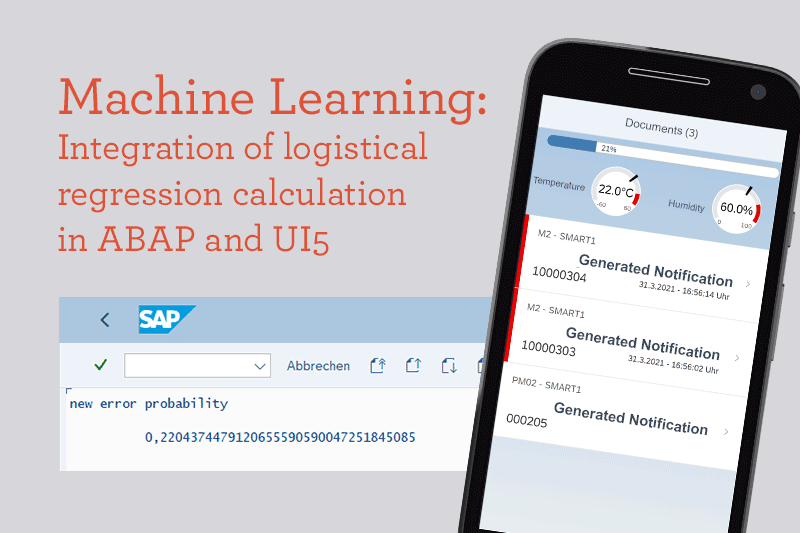
This article is about the development of a machine learning model. Technical progress contributes to a sharp increase in system complexity. The manual maintenance of machines, system components and production lines is correspondingly more complex and expensive. This is why automated maintenance is becoming increasingly important in the manufacturing industry.
The example of a machine learning model as explained below, calculates the probability of a machine failure on the basis of various sensor data and creates a corresponding maintenance message. In addition, the machine data and maintenance messages are visualized in a UI5 application.
Framework conditions and Scope: SAP Machine Learning Model
The aim is to train and evaluate a logistic model using historical machine data to predict machine failures. Training and evaluation take place exclusively in ABAP. An esp32 controller with temperature and humidity sensor connected to the SAP via a REST interface is used to generate new sensor or machine data. The incoming values are classified using the machine learning model in order to calculate the probability of failure. The project requires at least NetWeaver 7.4 for the gateway functionalities and UI5 libraries. SAP Predictive Maintenance or Leonardo solution are not required.
Process
To achieve this, the following sample process should be implemented: A production machine generates data and transfers it to the SAP system via the REST interface. They are stored there and both are used for training and evaluating a machine learning algorithm. The visualization of the data (probability of failure, sensors, maintenance messages) takes place via a UI5 or Fiori application.
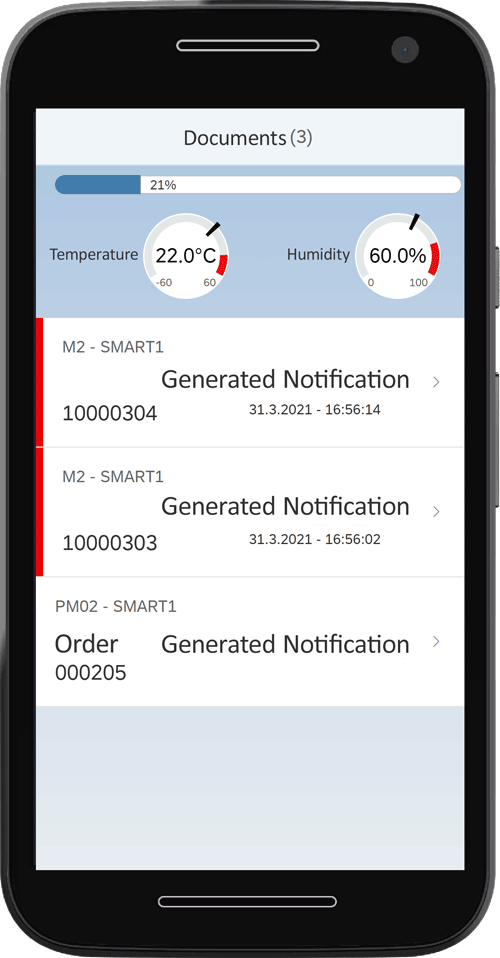
Fiori-Interface
A Fiori or UI5 interface is created to display the current probability of failure and sensor data as well as the currently available maintenance messages that were generated by the system. Push messages ensure that the machine data and maintenance messages displayed are always up-to-date.
What is logistic Regression?
With statistical or machine learning it is possible to understand complex data sets and to model complex relationships. A large number of statistical models and algorithms are available for this purpose. What they have in common is that they are trained on historical data in order to learn connections. This enables them to make predictions.
These models and algorithms can be roughly divided into two areas: Supervised and unsupervised statistical learning. The main difference between these areas is that in supervised learning the target variable is known. In the case of predictive maintenance, for example, historical data are typically available which, among other things, contain information about when an error occurred on the machine, while in unsupervised learning there is no target variable. A good example case is Netflix, when it tries to group films according to their similarity. The approach of supervised learning is used in the following. A classification problem is to be solved more specifically:
Given the current sensor data: would there be a machine breakdown or not?
Recognize breakdowns before they occur
Let us assume that a company would like to reduce the machine downtimes that occur in its production and the associated production breaks. To do this, it is necessary to know when a breakdown occurs before it does. Only measurement data from the machines concerned are often available. In this example we assume that the data is causally related. If the company knew when a breakdown is particularly likely, it could indirectly influence the machine failures per unit of time by adjusting the maintenance costs per unit of time. Statistical learning can be used to create a predictive model that predicts the likelihood of machine downtime based on the sensor measurement data. A prediction model is to be trained that learns how the prediction variables (sensor measurement data) are to be combined in order to predict a probability for the target variable (machine failures) as best as possible. Since it is a matter of forecasting probabilities, these are limited to the value range [0.1]. A statistical model must be used that is able to model the relationship between sensor measurement data and the error occurrence. Logistic regression is one of such a model. It models the probability of occurrence of an event (or a class affiliation) through the linear combination of one or more predictors.
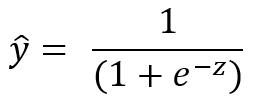
With a predictor X and a binary target variable Y, where Y = 1 indicates a disturbance, the model takes the following form:
![]()
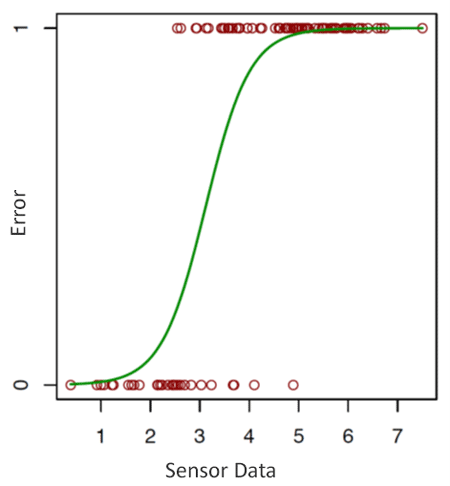
β0 is the coefficient for the constant, β1 and β2 are coefficients of the predictors (sensor data) X1 and X2. On the left side of the equation, the failure probability (y = 1) is described as a function of the predictors. The formula on the right will always give a result between 0 and 1 and an S-shaped curve. The aim is now to find the coefficients for the constant and the predictors that represent the true relationship between the predictors X and the target variable y in the best possible way. The probability that a fault is present is therefore modeled.
Sensor values as breakdown indicators
In general, the statistical model learns which sensor values indicate a breakdown. (Pr (Y = 1 | X) where Y = 1 is a breakdown). The estimation of the model parameters takes place with the help of the gradient method. The model only needs to be initially trained once and it can then be implemented as part of the business process. However, it is advisable to retrain the model at regular intervals to ensure the best possible forecast quality.
Model training / Estimation of coefficients
The model is initially trained using simulated data in the SAP system. After training, the model is able to classify each new data point in terms of the probability of indicating a breakdown. The values for temperature, humidity and machine failure observed in the past are used as training data. In this case, data is generated manually using an ABAP report. The data consists of a sensor value for temperature and humidity, as well as a flag for breakdown.
1000 data sets are generated, 70% of which are used for model training and 30% for the subsequent evaluation. Since ABAP has no functionality for machine learning, the logistic regression has to be implemented manually using the gradient method.
The method of model training is applied as follows:
- First, the parameters for the learning rate and the number of iterations for the gradient method are determined.In addition, the estimated values for the coefficients are defined (weights and bias).
- For the intended number of iterations and during each iteration, run through the gradient method on the training data:
- Prediction of the probability of failure based on the current coefficients of the constant and the predictors.The scalar product is calculated from the sensor values and the current estimated values of the coefficients (z).
z is the sum of the scalar product of the predictor vector X (sensor measurement data) and the estimated coefficients for the predictors and the constants.
b.) Transpose the training data to calculate the derivatives dw1, dw2, and db.nieren der Trainingsdaten zur Errechnung der Ableitungen dw1, dw2, und db.
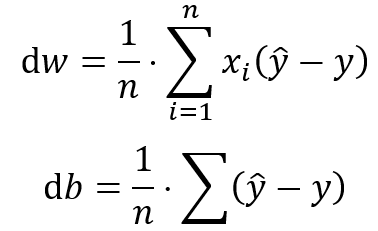
c.) Calculation of the gradients for the constant and the coefficients on the basis of the current estimation deviation from the true expression of the target variable. Updating the coefficients by multiplying the gradients with the learning rate. - d.)Updating the coefficients by multiplying the gradients with the learning rate
- Prediction of the probability of failure based on the current coefficients of the constant and the predictors.The scalar product is calculated from the sensor values and the current estimated values of the coefficients (z).
- Repeat from step two with the new estimated values until the number of maximum runs has been reached.
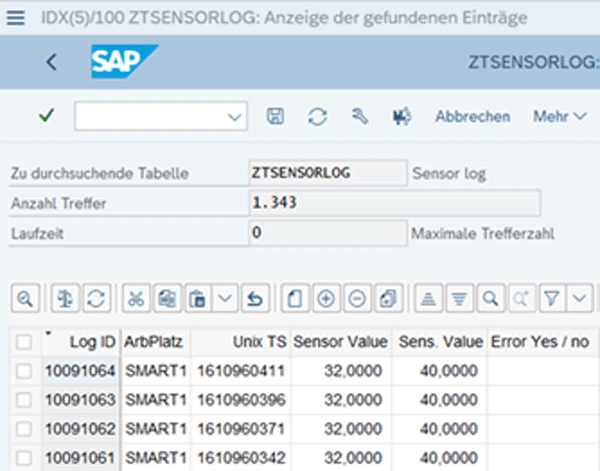
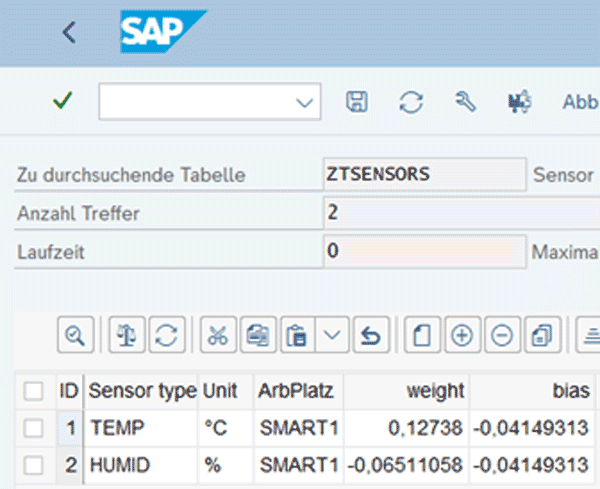
After completion of the training, the coefficients are stored in the ZTSENSORS table as “weights” and “bias”. Once new sensor data have been received, they are used to estimate the probability of malfunctions.
Evaluation/ Testing the Model Quality
After the logistic regression model has been trained, the reliability must be checked. Only then it becomes clear whether the modeling is able to make reliable predictions.
The logistic regression calculates a probability for the class affiliation (0 = no disturbance, 1 = disturbance). In the case of a binary outcome, four possible outcomes are possible with regards to the correctness of the prediction:
- False Positive: when a breakdown was predicted that did not occur.
- False Negative: when a breakdown was overlooked
- True Positive: when a breakdown was correctly predicted.
- True Negative: when a predicted breakdown has not occured .
If the trained model is applied to the evaluation data set, the following values result:
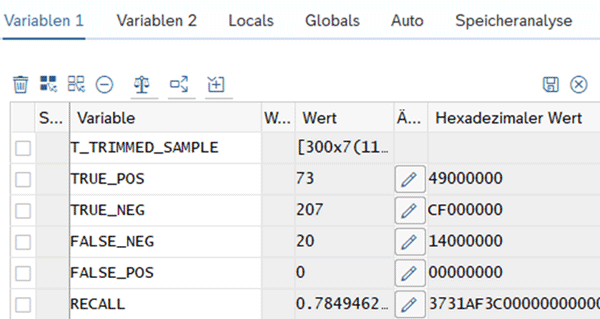
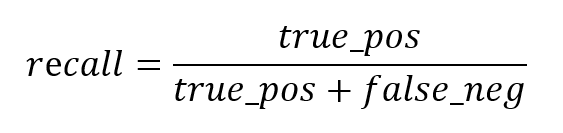
The recall value is calculated using the formula below and indicates what percentage of the actual disturbances were correctly predicted. With the currently selected parameters, 78% of the malfunctions are recognized. This value can be continuously improved by adjusting the parameters or adding further independent variables.
Prediction based on data points
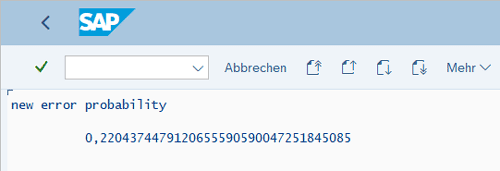
After the coefficients have been successfully estimated, new sensor values for X1 and X2 can be inserted into the formula.
![]()
The result is the error probability in percentage.
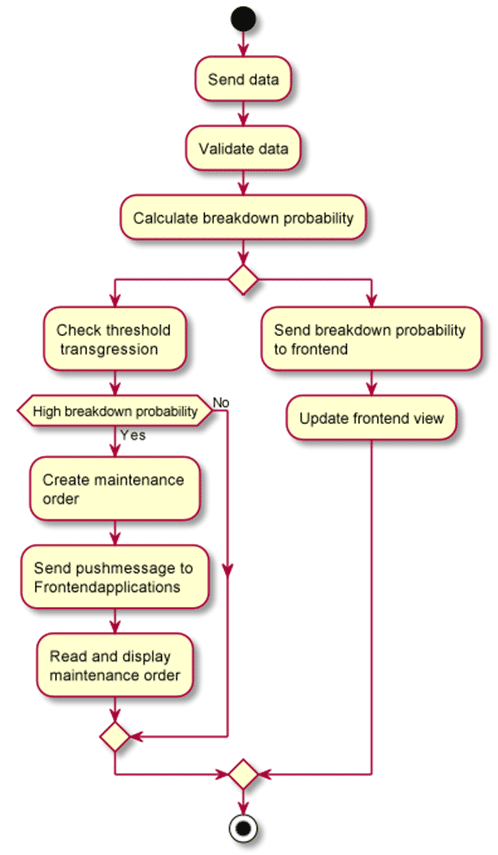
Sample process in SAP
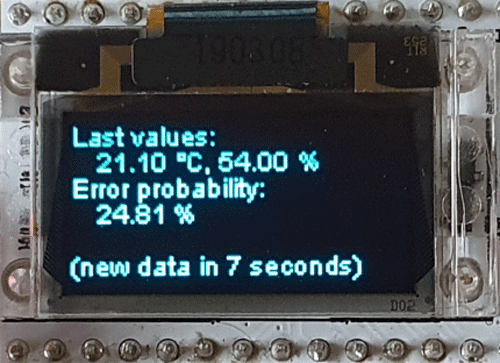
Continuous generation of measured values for temperature and humidity
In order to map a realistic process, an esp32 controller is used to simulate the sensors on the production line. A sensor module measures humidity and temperature. Any number of sensors are conceivable at this point. The sensor chip sends data to the SAP system every ten seconds. Through the transfer, the failure probability is calculated with the help of the model trained above and shown as a result on the display of the controller.
A REST interface is set up with the help of the SAP gateway in order to enable processing the data in SAP. The sensor data is received here and then processed further. The event is logged in the backend and the UI5 clients are informed of the new probability of failure by push message. If a certain threshold is exceeded, a maintenance message will be created and will also be reported to the frontend.
Every sensor ping and the model’s reaction are recorded in the application log.